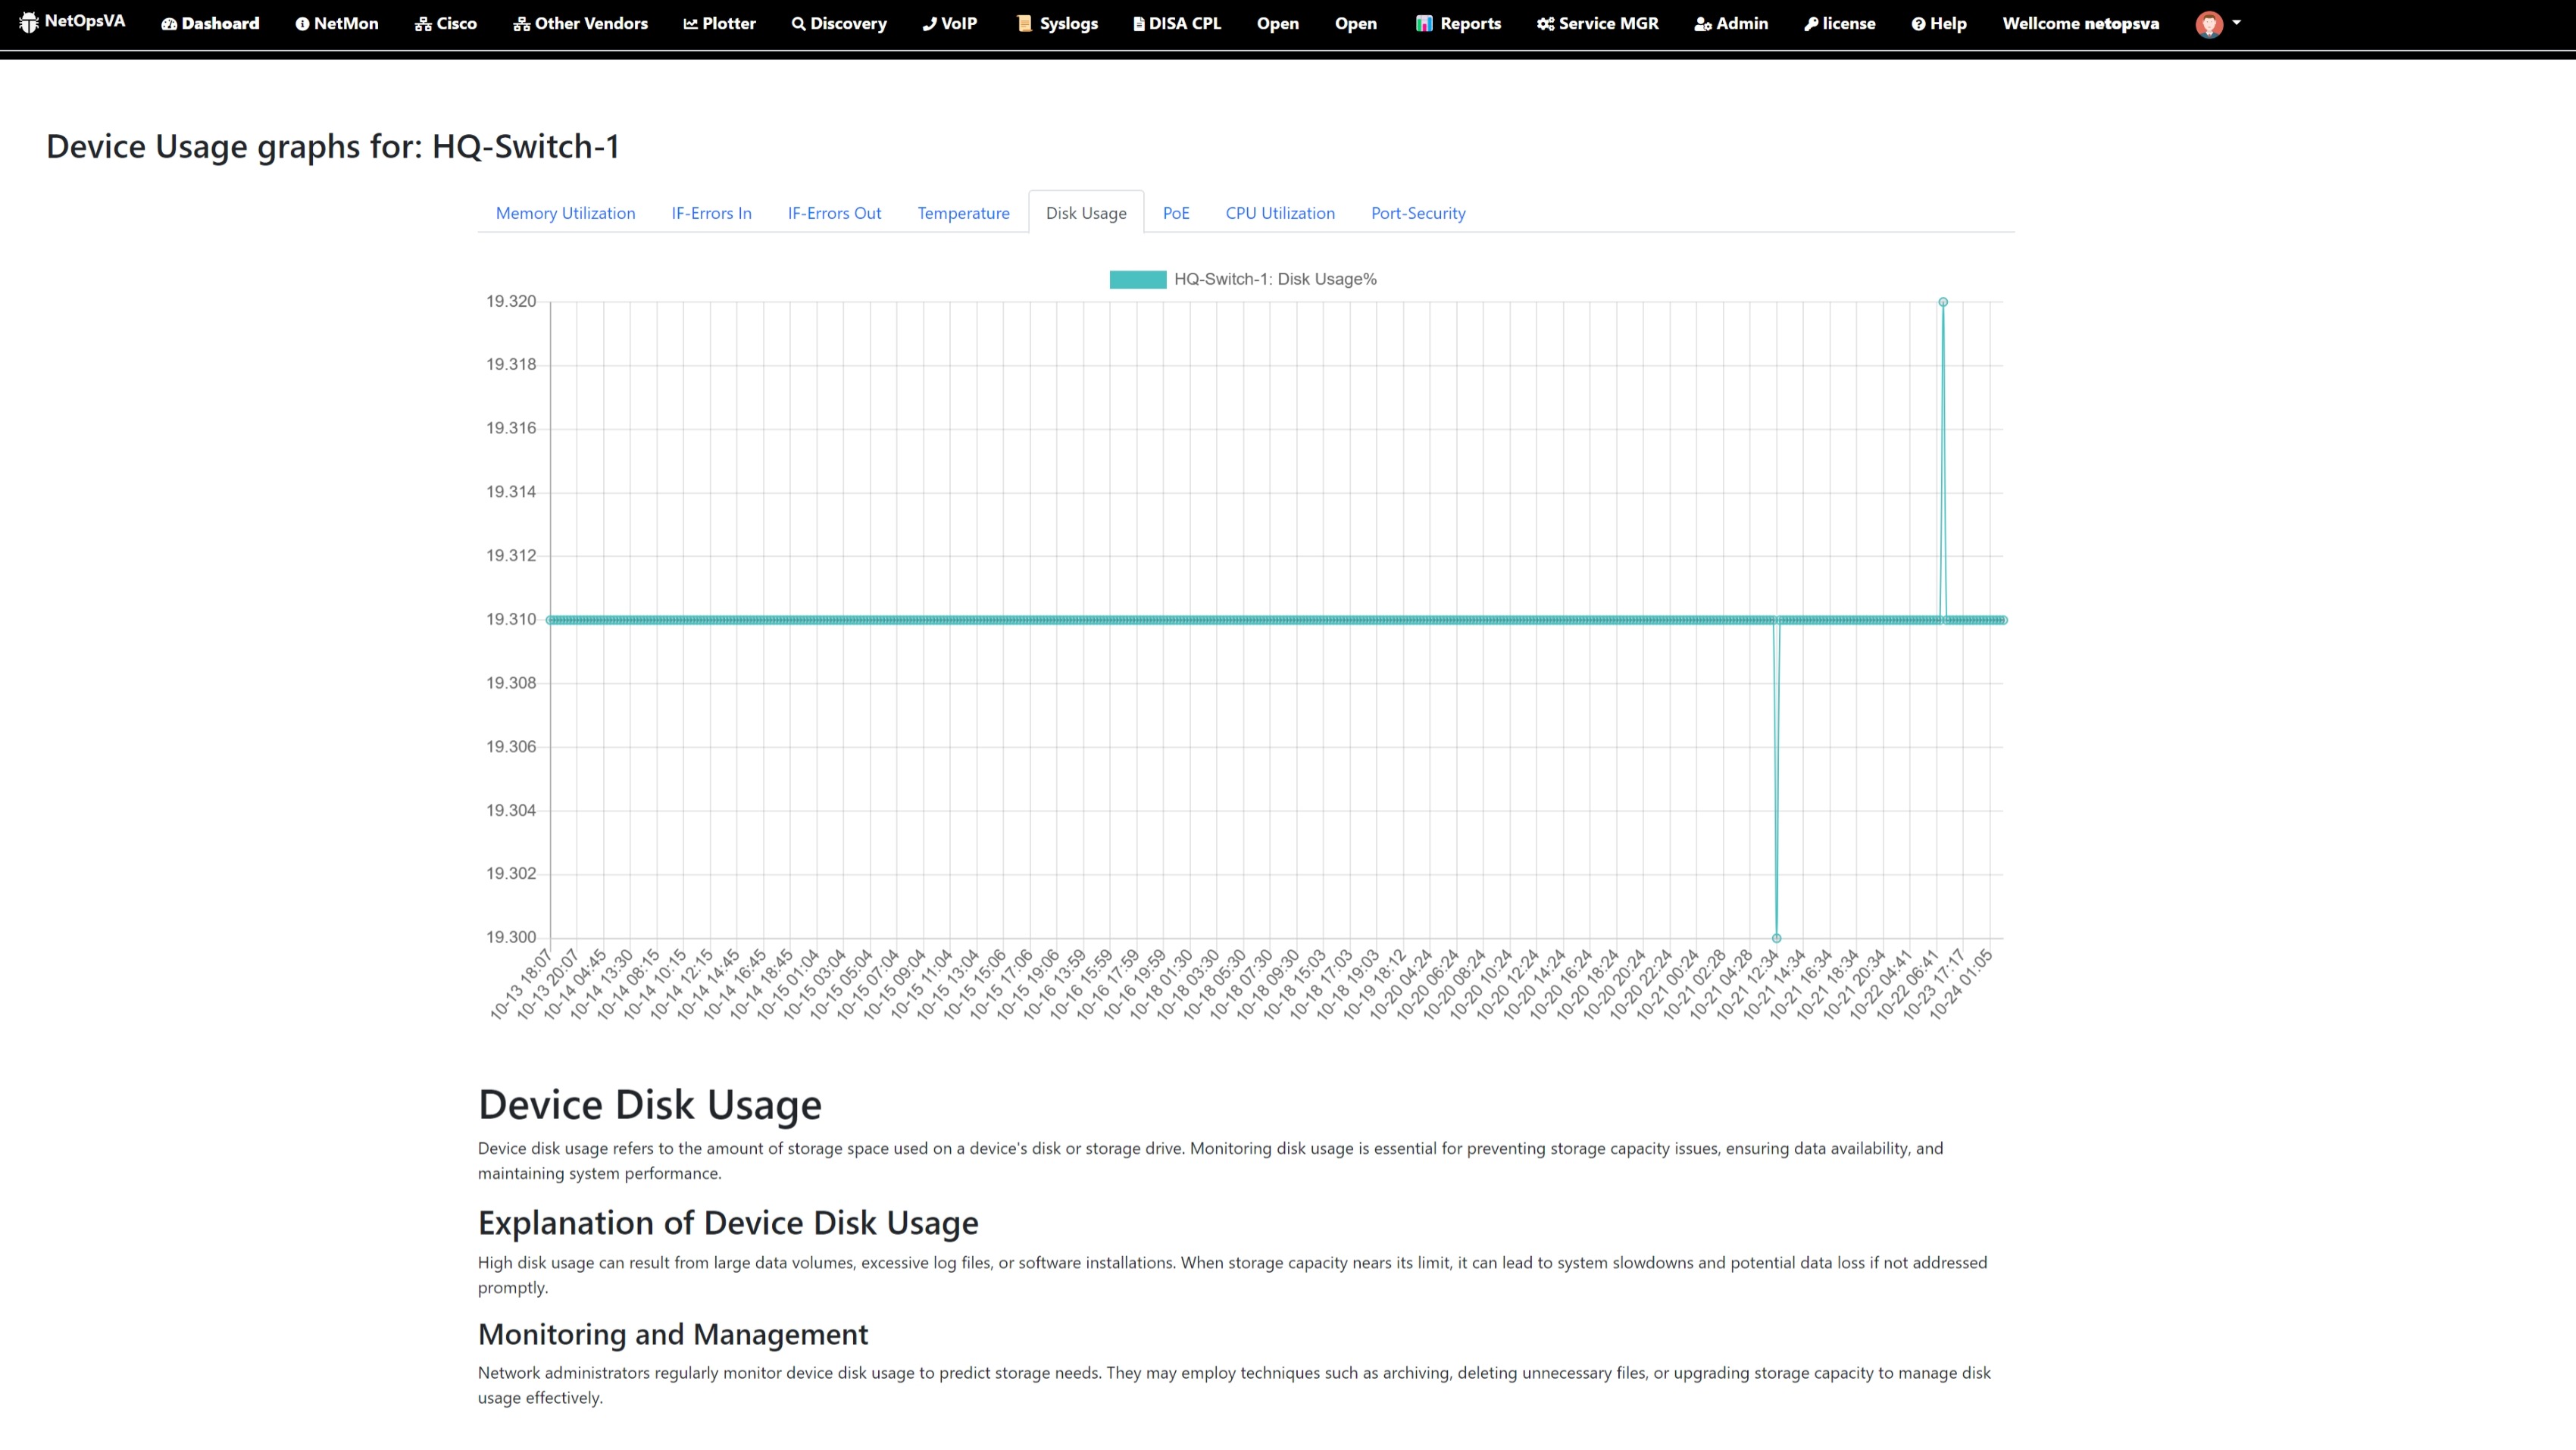


NetOpsVA is employed to conduct network device health assessments by interrogating specific data fields, overseeing crucial system metrics including memory utilization, disk storage, CPU performance, Power over Ethernet (PoE) consumption, temperature, Quality of Service (QoS), total error counts for inbound and outbound traffic, and port security violations, among others.


NetOpsVA tracks and records various crucial metrics, including:

NetOpsVA rovide real-time device status updates by pulling data from network devices at regular 15-minute intervals. This frequent data retrieval ensures that administrators have access to the most up-to-date information about the network's health and performance.
The platform allows users to create intuitive and informative graphs and charts that visualize various network parameters such as device bandwidth utilization, error rates, and more. These graphs provide a clear and easily understandable snapshot of network trends and performance metrics. Administrators can spot patterns, anomalies, and potential issues quickly, helping them make informed decisions to optimize network efficiency.


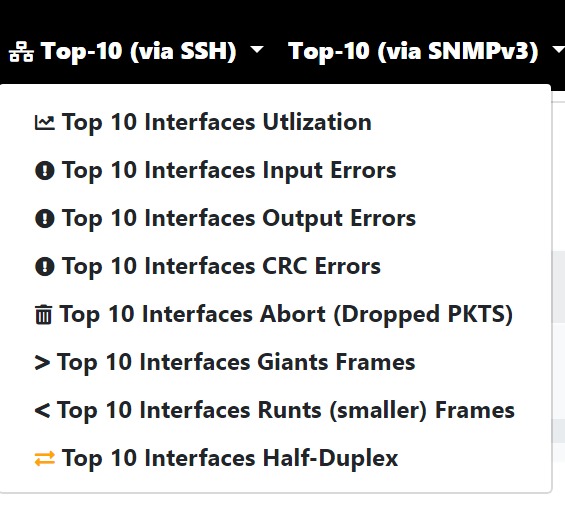
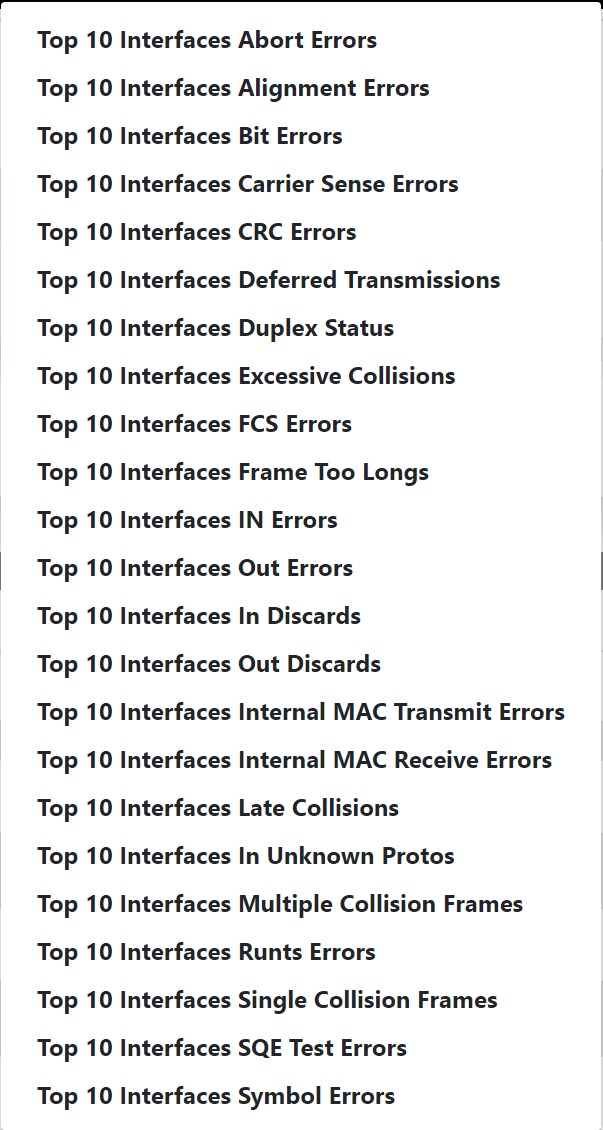
NetOpsVA utilizes Secure Shell (SSH) and SNMPv3 protocols to access and analyze network devices and their interfaces. This robust solution provides in-depth insights into the performance and health of your network infrastructure.
Here's how NetOpsVA assists in monitoring the top 10 interfaces:
**Utilization**: NetOpsVA offers real-time data on interface utilization, allowing administrators to gauge the traffic load on each interface and make informed decisions about resource allocation.
**Input and Output Errors**: By tracking input and output errors, the platform helps identify communication problems, ensuring that data transmission is error-free and reliable.
**CRC (Cyclic Redundancy Check) Errors**: NetOpsVA keeps a close watch on CRC errors, which can indicate issues with data integrity. Identifying these errors is crucial for maintaining data accuracy.
**Duplex**: NetOpsVA provides information on the duplex setting of each interface, helping administrators ensure that devices communicate effectively by using either half-duplex or full-duplex modes.
**Alignment Errors**: Detecting alignment errors is essential for maintaining data consistency and preventing data corruption during transmission.
**Bit Errors**: NetOpsVA identifies bit errors, which can occur due to signal interference or other issues, and helps administrators take corrective actions to maintain data integrity.
**Symbol Errors**: Monitoring symbol errors is crucial for ensuring the correct interpretation of signals and preventing miscommunication between network devices.
**MTU (Maximum Transmission Unit)**: The platform reports the MTU size of each interface, helping administrators optimize data transfer and prevent packet fragmentation.
**Interface Status**: NetOpsVA continuously checks the status of each interface, providing a real-time view of their availability. This information is critical for detecting interface failures or issues.
**Traffic Statistics**: NetOpsVA presents detailed traffic statistics for each interface, allowing administrators to understand the types and volumes of traffic passing through, which can be crucial for optimizing network performance.